TL;DR:
Our industry doesn’t have the right definition of Observability and it’s going to cost enormous amounts of money and cause continued outages until that changes. ((Normally in this blog I don’t talk about things close to work much, because I’m a software engineer at a large company and engineers in that position leave work at work most of the time lest we be perceived as speaking for our company by people who don’t yet understand that companies do not usually let engineers handle public relations for rather good reasons. This post is an exception because it’s a very nonspecific thing that impacts our entire industry, not just one company. It’s my thoughts on this, not my company’s (they don’t pay me enough to work in PR).
For context, I’ve been working in monitoring for a decade or so and relying on it for about three decades. My original background was in both electronics and computers, so it focussed more on control theory and statistics and the device driver level of programming than it did on writing word processor applications and the like. Because of that I came to the monitoring field with a formal background in what monitoring is actually for and that influences my opinions.))
I’ve been getting increasingly frustrated with something for the last year or four. Mostly it gets dismissed because it’s difficult to monetise even though it’s not difficult to actually understand or implement. Engineers are so close to it that they rarely think about it and vendors think it’s not readily profitable which is a situation that lends itself well to being deliberately ignored. Specifically, I’m talking about the large gap between what our industry calls Observability and what Observability actually is.
And that gap is not some academic triviality – it means that there is a massive gaping hole in our tooling which directly results in lost revenue and a lot of grief and unnecessary work for engineers.
Observability tooling is simply not fit for purpose right now, not from any vendor. It’s not enough to have nice UIs and to be able to click from a metric to a log to a trace. Those are “nice to haves”. What we actually need to have is support in our tooling to let engineers readily codify their own mental models of how their service works so everyone else can see what’s going on without needing all the context and experience that the original engineers had to have to build up those mental models.
Detection of the difficult, nuanced nasties in our systems, and correctly answering hard questions like “how badly will this AWS API degredation affect our app’s latency” or “how much is it going to cost to run this service in two years at this growth rate” cause headaches in almost every company at every scale above “we have just one engineer and she knows how everything works”. Answering those questions correctly while engineers’ mental models are still stuck in their heads is often difficult or even impossible, because the answers are formed by combining several people’s knowledge and it won’t all fit in one head. We need to be able to codify models because that lets other people using them with their data to answer these questions, or even automate answering them.
But right now we can’t do this easily, because in the monitoring industry over the last few years, the term “Observability” has been used exclusively as a marketing term; at first by a few vendors, and then more and more, but they have all used it to mean, in essence, “our product”. None have used the actual definition of the term or anything close to it, and so nobody has been working on the missing tools we need to achieve it.
The difference between what the term actually means and what we’ve been using it for is why just pushing to adopt what any particular vendor describes as observability tools isn’t a solution to any monitoring team’s problems. Observability in reality is a very fundamental concept and like most fundamentals, it can be stated in a very straightforward and easy to understand way. In five steps, it goes like this:
1. We have a system. This system can be anything – whether that is your company’s application as a whole, a particular service, a particular host or anything else does not matter.
2. We have a model of this system which has some number of internal states. Whether that’s two states (“Working” and “Broken”) or two million does not matter.
3. We have some outputs from the system. Whether these are in the form of metrics, logs, traces or something else does not matter.
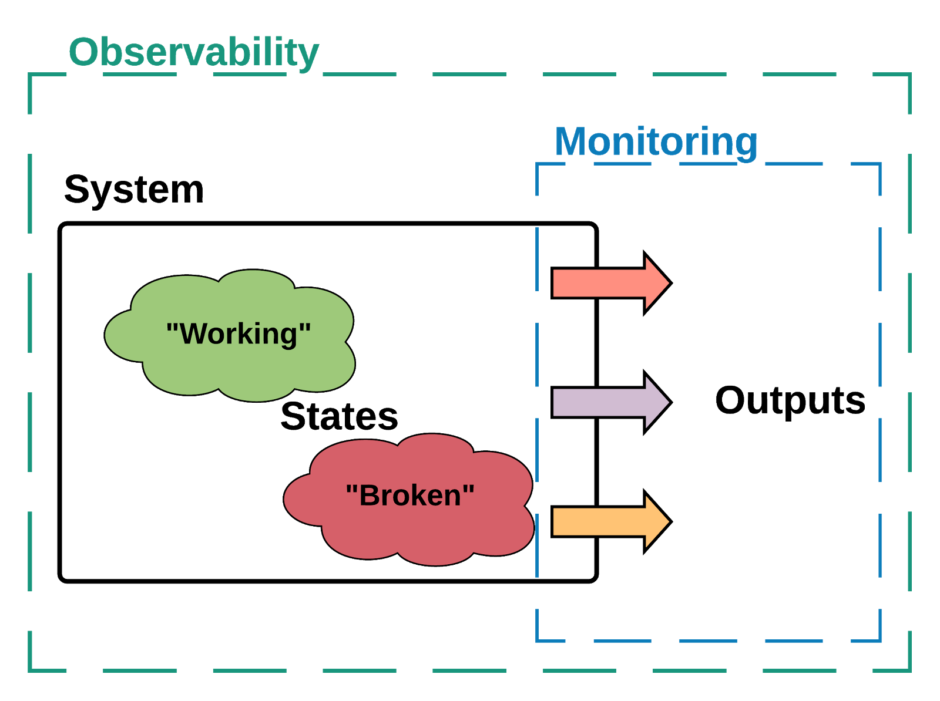
4. If we can tell what internal state the system is in just by watching the outputs, then that system is Observable. If there are states the system can be in, but we cannot tell that we are in them from watching the outputs, then that system is only partially observable.
5. The system’s Observability is a measure of how many states we can tell we are in compared to how many states there are in our model.
Yes, I know that the Wikipedia definition is more involved. And if you’ve studied state space modelling and done a few courses on control theory, the Wikipedia definition is a better one. If you’re also familiar with the history of formal methods in computer science, you’ll know why this doesn’t really matter; and if not, the short version is that we as an industry can’t really create formal models for our systems because we don’t understand them well enough and we don’t teach the math for that to enough engineers, so a simple view of Observability is all we can use right now. But it is sufficient to do real work with.
Mostly the industry has looked at the original definition of Observability – when it’s looked at it at all – from the point of view of outputs, and making outputs more readable and making it easier to create new outputs. That’s where we got the deeply unhelpful “three pillars of observability” meme from. But for us as engineers and for companies in general the far more important part today is the other critical component the definition talks about — it requires that we have a model of the system. Monitoring is necessary but not sufficient to give us Observability.
Right now, we can pick any vendor you choose, build the ultimate data platform, ship all the metrics and logs and traces and any other data we can think of so that we can view it at any resolution, at any frequency of updates, in any combination, using any graphical display and we still won’t know what is going on without that model. We could have built the world’s best monitoring system and we wouldn’t be able to tell what’s going on.
Right now, that model only exists in the heads of us as engineers (especially those of us who pull shifts on-call). We can read some specific metrics or logs and tell you that a particular service is broken and how badly and why and what has to be done to fix it. And if one of us walks in front of a bus tomorrow (or, y’know, catches Covid-19), or gets poached by another company, or retires; well that model is now lost for as long as it takes another engineer to relearn it, if they can. It also means that onboarding of new hires takes longer than it has to, and that our systems are more opaque to the rest of the company.
Don’t believe me? Sit a C-level executive or a new hire down in front of a raw dashboard and ask them what the system is doing. They won’t have the context, so they won’t know. If they don’t give up immediately and think it’s a prank, they’ll probably look at the dashboard and in front of your eyes, try to build a model from scratch using any metadata they can find like the titles of graphs or the units on axes or using past data in the graph to see if the last hour looks different from the last week. You’ve probably seen new hires doing this during their onboarding if you were supervising, training or mentoring them.
This is the largest weakness in the monitoring industry’s market offerings at present. The industry is wholly focussed on extracting outputs in various forms from the system and presenting them to engineers in various ways, or giving them toolkits to do so themselves. Competition has centered on how many data points a vendor can ingest, on their pricing models, on comparative evaluations of their UIs and several other things of little fundamental merit. Very little attention has been given to developing tools that allow us to extract the model from the engineers’ heads and codify it so that people without their institutional knowledge can understand what is going on.
Yes. We’ve all heard of the wonderful sunlit uplands described with marketing terms like MLOps and AIOps, and there’s a wealth of things that could be said about this citing a history going back through Machine Learning, AI, Big Data, Heuristics, AI again, Expert Systems and even further back depending on how long you’ve been in this industry, but suffice it to say that these systems cannot do this job, they explictly have no deeper context and just try to find patterns in data without understanding the data. When the lead of Google’s ML-for-SRE program says so openly in conference talks, maybe the time has arrived for the industry to accept that throwing data at a black box and hoping for magic to happen just isn’t a workable plan here.
Worse yet, the current trend is to talk about how Observability solves the “unknown unknowns” problem, ie. recovery when the system is in an unknown state. This is a category error. Observability is basically the ratio of the number of states you can tell you’re in to the number of states in your model; if you’re in an unknown state then your model was incomplete and how can you now use observability to fix your model? The idea is gibberish.
The reality is that if you are in an unknown state, you don’t know what’s going on, by literal definition. You need to build a new model or extend an old one to cope. This puts you in the category of fault diagnosis, not monitoring. You will be actively opening up the black box of the system and poking around to figure out what happened and that puts you outside the entire mathematical framework of observability. In that scenario, Observability is the end goal, not the means to get there. And you will need different tooling and there’s precious little going on in that space either.
The obvious question at this point is, “So what? Why does this matter? How does it cost us money to not do this?”. Okay, let’s look at the money.
Monitoring SaaS providers have various different billing models but to one extent or another, they all boil down to this: you pay according to the number of data points you produce. Produce more points, pay more money. This is less pronounced for on-prem solutions but their resource requirements mean that the same effect is there, just less directly measured and harder to plan for. This creates a tension between Engineering teams wanting to ship all the metrics they can at a very high frequency; and Finance teams wanting to reduce the final bill that creates. And one of the oldest tropes here is when Finance asks “do you need all these metrics” and Engineering says “I don’t know what I need to know until I need to know it”. This Sir Humphrey-esque response is caused by not having an adequate model of the system. Teams who have such a model, even informally in their heads, know what they need to see as outputs, and how often. It lets them produce data points showing what they need to know and not bother with what they don’t care about. It reduces their costs. The more they codify these models, the lower the final cost.
When something does go wrong, having a model of the system that isn’t in an engineer’s head makes automated fault detection possible, and opens the door to the possibility of automated or assisted remediation (this leans into the next buzzword the monitoring industry is going to co-opt, Controllablity), all of which reduce time to restore service and allows companies to both meet SLAs and to have tighter SLAs and reduces penalty payouts and makes sales easier as your reputation for reliability increases.
Beyond the immediacy of operational requirements, when you have a model of a system, you can make better predictions about what it will do in the long term. This means predicting the costs of meeting teams’ and customers’ needs. It means the ability to invest when it’s needed and not until needed, and it lets you understand the right amount to invest.
In other words, if we as an industry want to improve reliability, reduce opex, optimise capex and know what is actually happening with our systems as it happens, then our true goal is to build an observable system and that requires two things – monitoring and modelling.
We have monitoring today and we will continue to improve it. We do not have modelling, and no vendor seems interested in providing it right now. Instead we find ourselves witnessing a rerun of the Intel-v-AMD frequency wars in a new space as competing vendors claim they can ingest more data points per second than their competitors (and as happened in the frequency wars, are looking to pivot to a new metric like cardinality as they hit fundamental limits), as if that was what was needed. Or we see them make up a definition of what Observability is and try to leverage that, as if that could help.
As an engineer at the coal face, I’d be happier if they would just build the tools we desperately need instead.
